



Highlights:
DMJPS is pleased to provide a statewide quarterly economic report with highlights of North Carolina’s fifteen metros for the fourth Quarter of 2023. Indicators suggest the state maintained a steady growth pattern, although this was largely moderate.
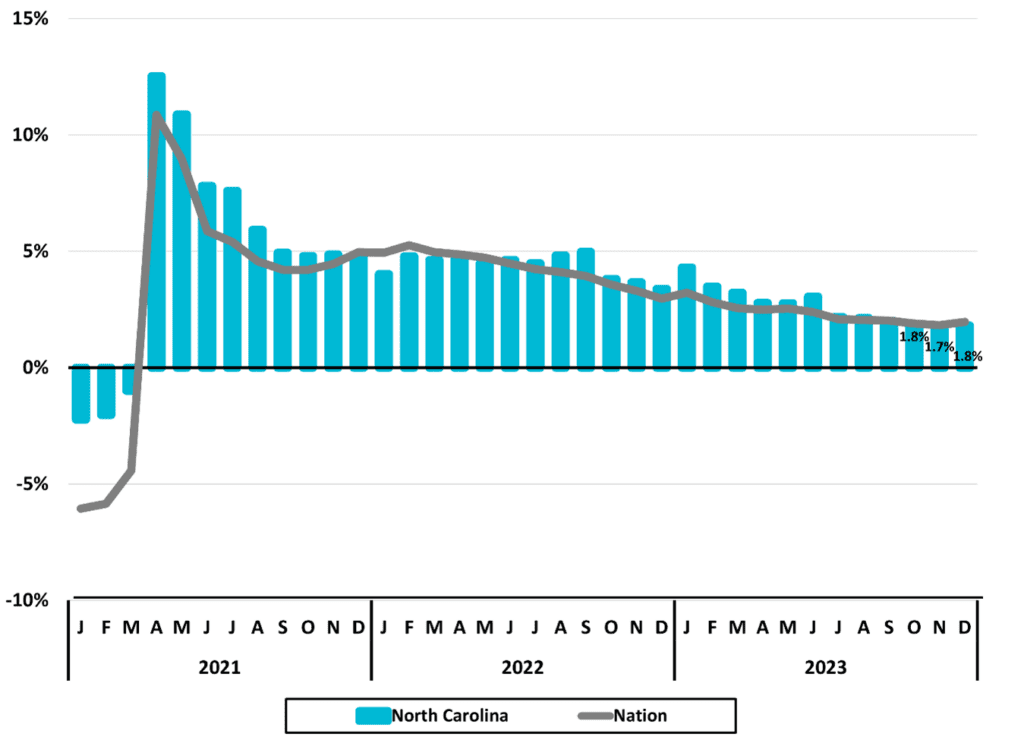
• In the fourth quarter of 2023, North Carolina added approximately 87,600 jobs year-over-year, climbing to an average of 4.9 million. This established a new quarterly record, although the growth rate of 1.8 percent trailed the national rate of 1.9 percent.
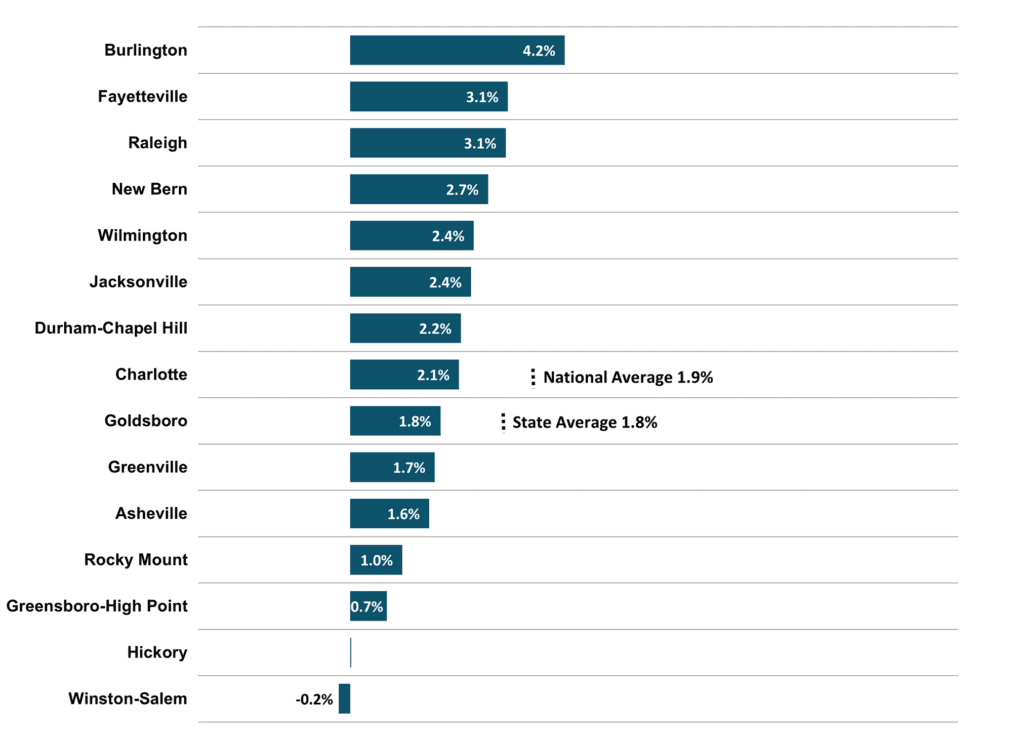
• At 4.2 percent, the Burlington metro had the greatest rate of increase in employment in the fourth quarter when compared to the prior year.
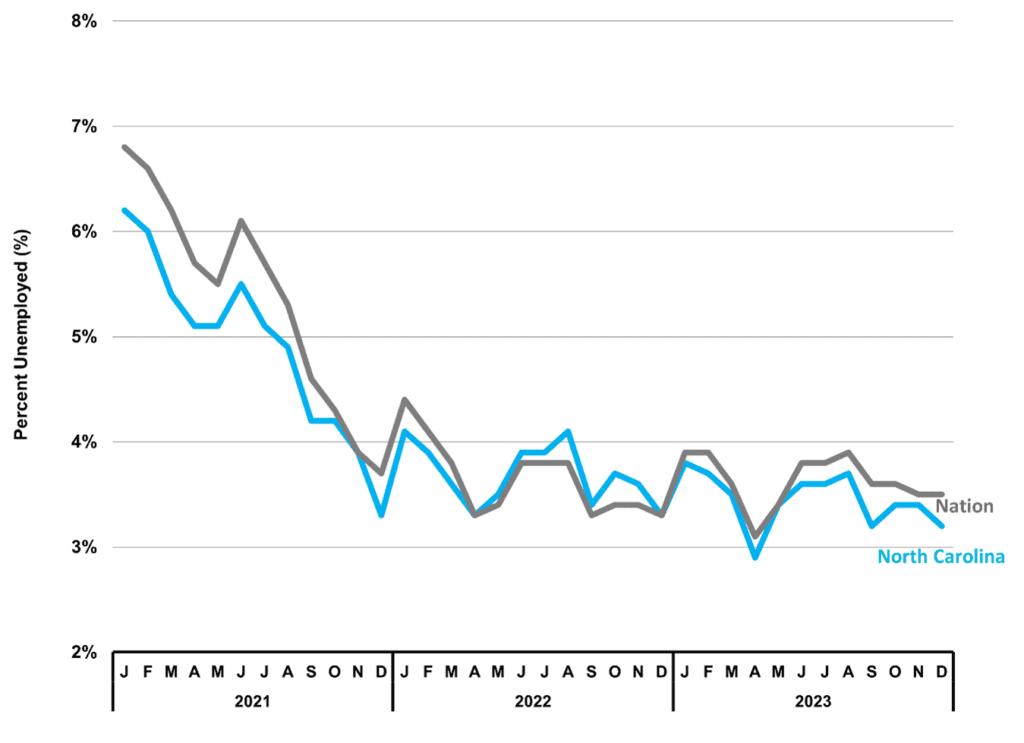
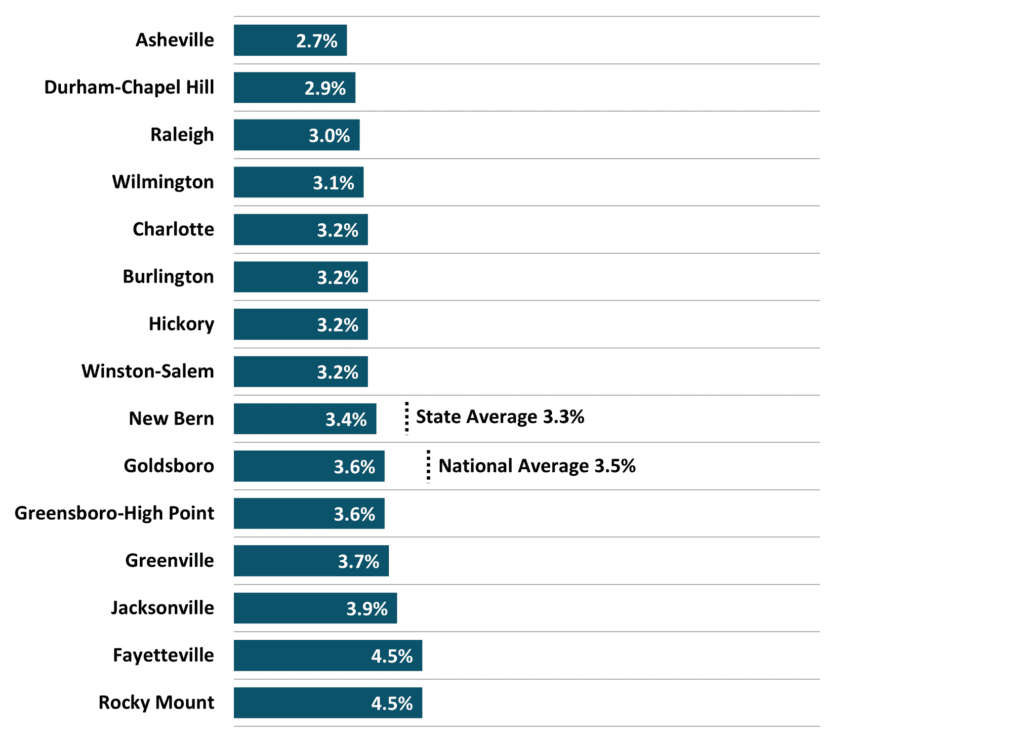
• North Carolina’s fourth quarter average unemployment rate of 3.3 percent was lower than the national average of 3.5 percent. Among the state’s fifteen metros, the Asheville metro had the lowest average unemployment rate of 2.7 percent.
• The Leisure and Hospitality industry led fourth quarter year-over-year employment growth in North Carolina. Four major industries showed year-over-year decline.
• The private industry average hourly wage in North Carolina rose to $31.75 in the fourth quarter with the Durham-Chapel Hill metro in the lead at an average of $36.55. Durham-Chapel Hill and Charlotte metros exceeded both the state and national fourth quarter average hourly wages.
• At 6.3 percent, North Carolina’s same-home annual appreciation rate in the fourth quarter outpaced the national rate of 5.7 percent.
• The average taxable retail sales estimate in North Carolina in the fourth quarter approached $61 billion, surpassing the $60 billion threshold for the first time.
• Special feature, veteran status: According to the U.S. Census Bureau, at an estimated 7.5 percent, North Carolina ranked 14th among the fifty states in 2022 for percentage of the civilian population aged 18 and over with veteran status.
Detailed Analysis:
Employment
In the fourth quarter of 2023, employment averaged 4,993,167 employees in the state of North Carolina, currently the highest quarterly average on record. This reflected an average percentage increase of 1.8 percent but lagged the national 1.9 percent (Figure 1). Looking at each quarter for the past five years, the state’s year-over-year growth rate has lagged the national rate only three other times.
Figure 1
North Carolina Total Employment
Monthly Year-to-Year
Percent Change
 Source: US Bureau of Labor Statistics
North Carolina’s fastest growing metro in the fourth quarter of 2023 was Burlington with a 4.2 percent increase in employment when compared to a year earlier (Figure 2). The Hickory metro remained flat. The Winston-Salem metro was the only metro with an estimated employment loss (-0.2 percent). Six metros experienced year-over-year growth rates that trailed the overall state average. However, eight metros surpassed the state average while the Goldsboro metro’s rate of increase was on par with the state’s 1.8 percent.
Figure 2
2023 4Q Average
North Carolina Metros
Employment One-Year Percent Change
 Source: US Bureau of Labor Statistics
Averaging 3.3 percent over the fourth quarter of 2023, North Carolina’s unemployment rate was lower compared to the national average of 3.5 percent (Figure 3). This marked four consecutive quarters where the state’s unemployment rate was lower than the nation’s.
The fourth quarter unemployment rate in the state translated into roughly 175,135 people who were unemployed, a decline of 3.9 percent compared to a year earlier.
Figure 3
North Carolina
Unemployment Rates (%)
 Source: US Bureau of Labor Statistics
Each of the state’s fifteen metros experienced an average unemployment rate below five percent in the fourth quarter of 2023 (Figure 4). The Asheville metro had the lowest fourth quarter average unemployment rate at 2.7 percent, followed by Durham-Chapel Hill at 2.9 percent. Eight of the state’s metros experienced average unemployment rates that were below the state average.
Figure 4
North Carolina Metros
Unemployment Rate (%)
2023 4Q Average
North Carolina Metros
 Source: NC Department of Commerce
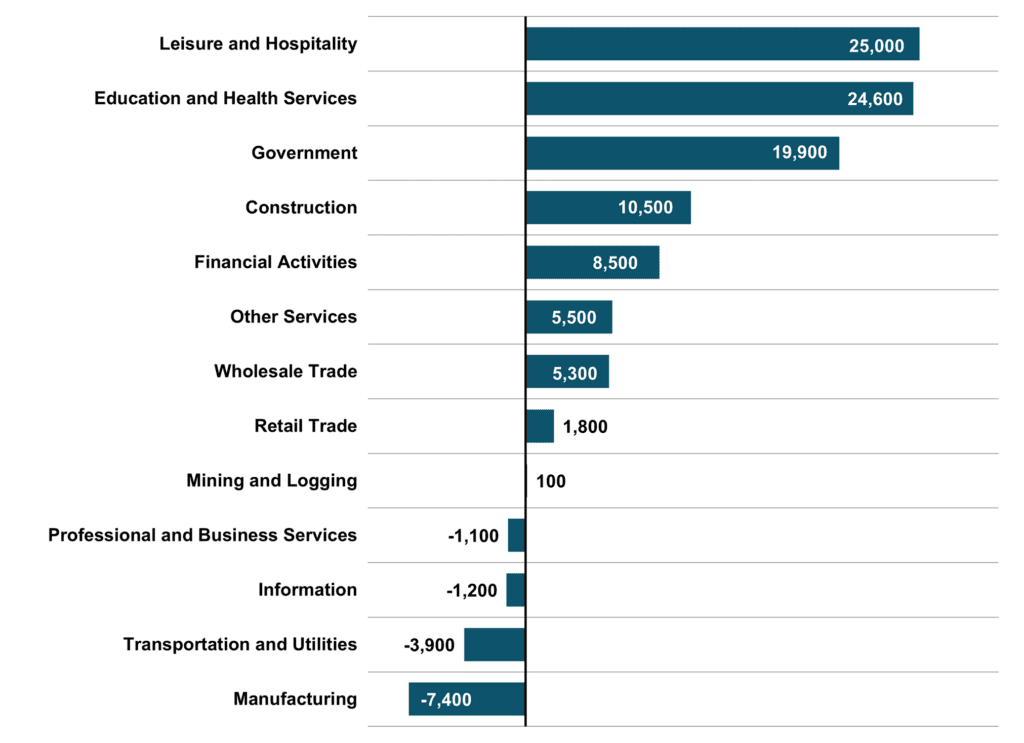
In the fourth quarter of 2023, North Carolina had an overall gain of 87,600 jobs compared to the prior year. Nine of thirteen major industries experienced gains led by Leisure and Hospitality with 25,000 new jobs (Figure 5). Manufacturing lost the most jobs at -7,400. While four major industries experienced a loss compared to the prior year’s quarterly average, decline may reflect a national track and the point-in-time estimates are too preliminary to suggest a longer term trend.
Figure 5
North Carolina – 2023 4Q
Major Industry Employment
One-Year Change
 Totals rounded to nearest 100.
Source: US Bureau of Labor Statistics
Wages
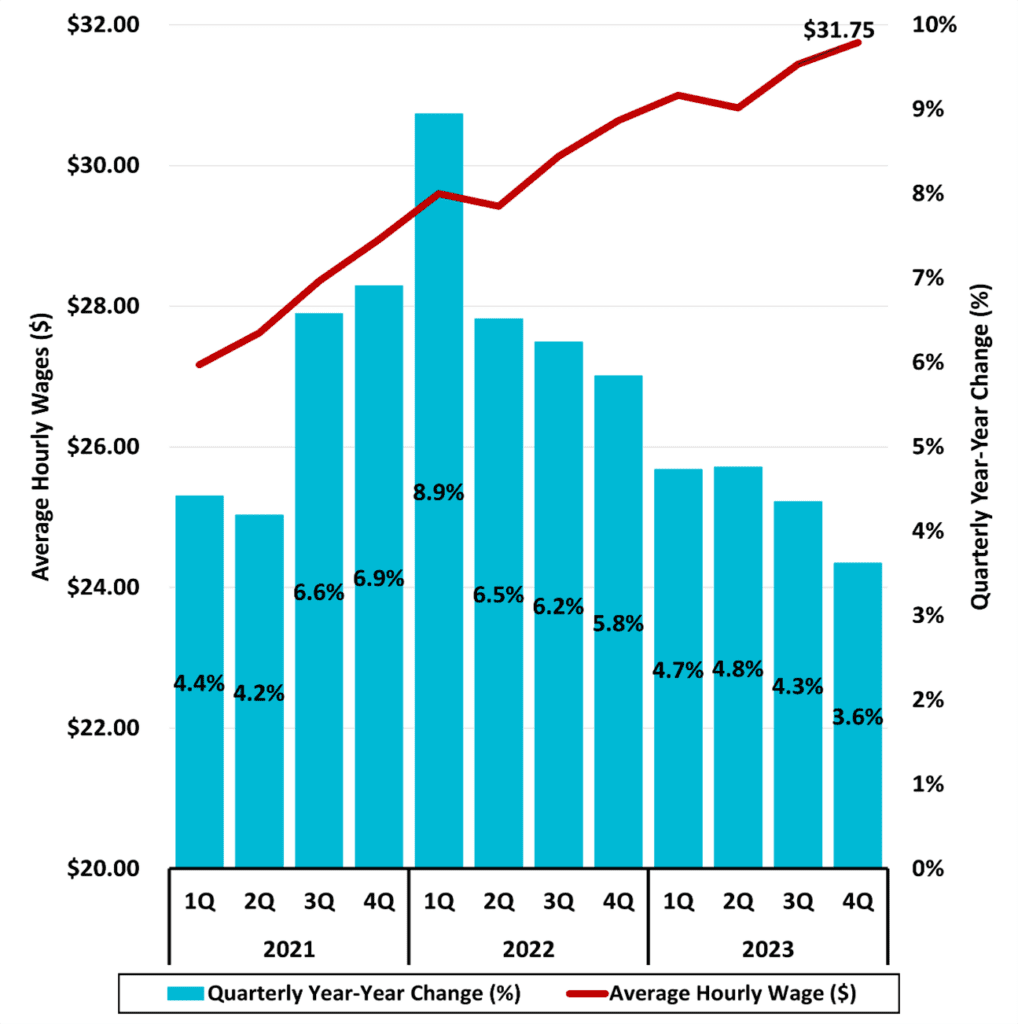
Private industry average hourly wages in North Carolina rose to $31.75 in the fourth quarter of 2023 and established a new high point with a 3.6 percent increase compared to the prior year (Figure 6). The year-over-year growth rate has slowed since the first quarter of 2022 with a slight uptick between quarters one and two of 2023.
Figure 6
North Carolina
Average Hourly Wages
Private Industry
 Source: NC Department of Commerce
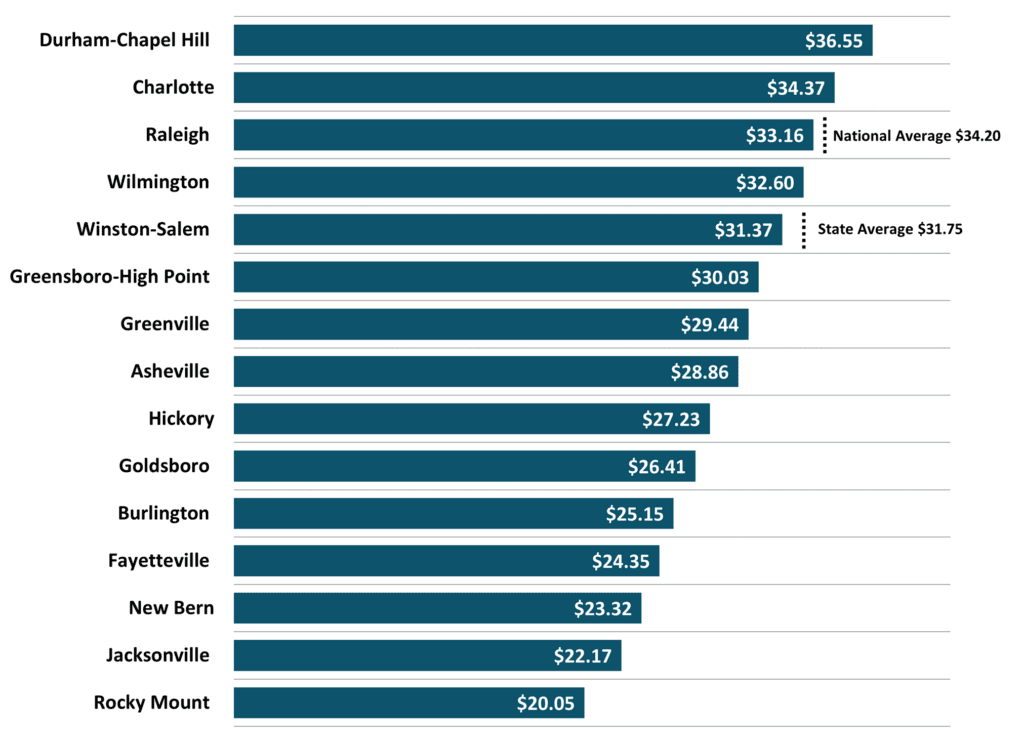
The Durham-Chapel Hill metro led the state’s fifteen metros with a fourth quarter average hourly wage of $36.55 (Figure 7). Four of the state’s fifteen metros exceeded the overall state average of $31.75. Two metros exceeded the national average of $34.20 as well: Durham-Chapel Hill ($36.55) and Charlotte ($34.37).
Figure 7
North Carolina Metros – 2023 4Q
Average Hourly Wages
Private Industry
 Source: NC Department of Commerce
Housing
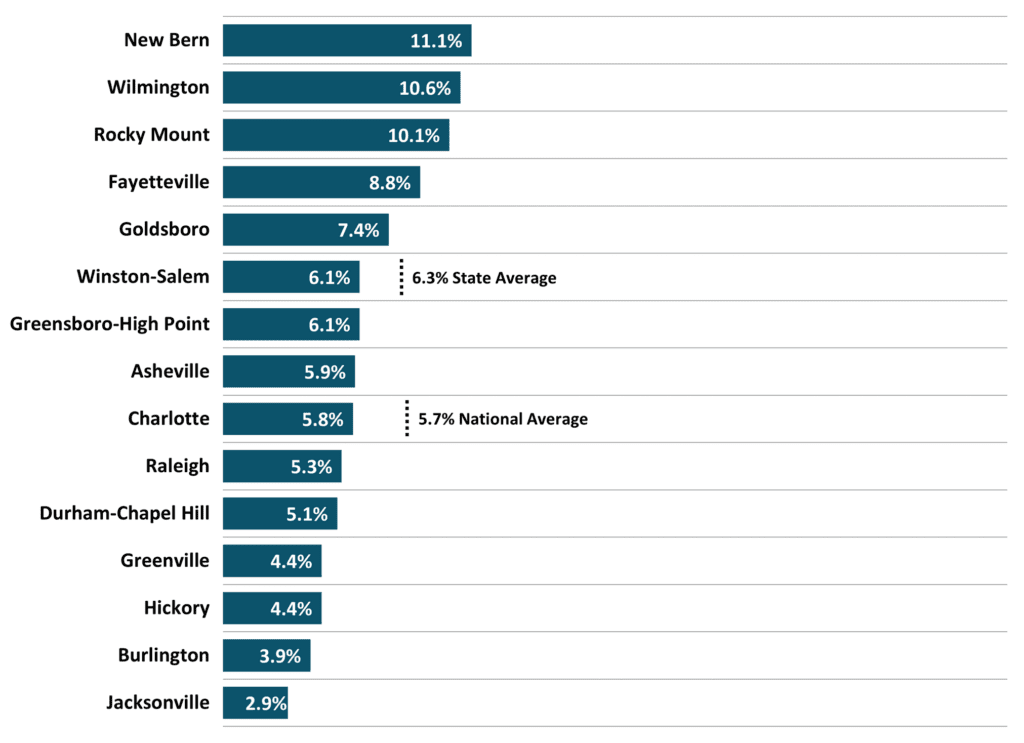
At 6.3 percent, the state of North Carolina’s same-home annual appreciation rate in the fourth quarter exceeded the national rate of 5.7 percent (Figure 8). The New Bern metro ranked first among the state’s fifteen metros at 11.1 percent. Five metros exceeded the state’s overall average while the Jacksonville metro’s 2.9 percent appreciation rate was the smallest rate of increase.
Figure 8
North Carolina Metros
Same-Home Annual Appreciation Rate (%)
2023 4Q
 Source: Federal Reserve Bank of St. Louis
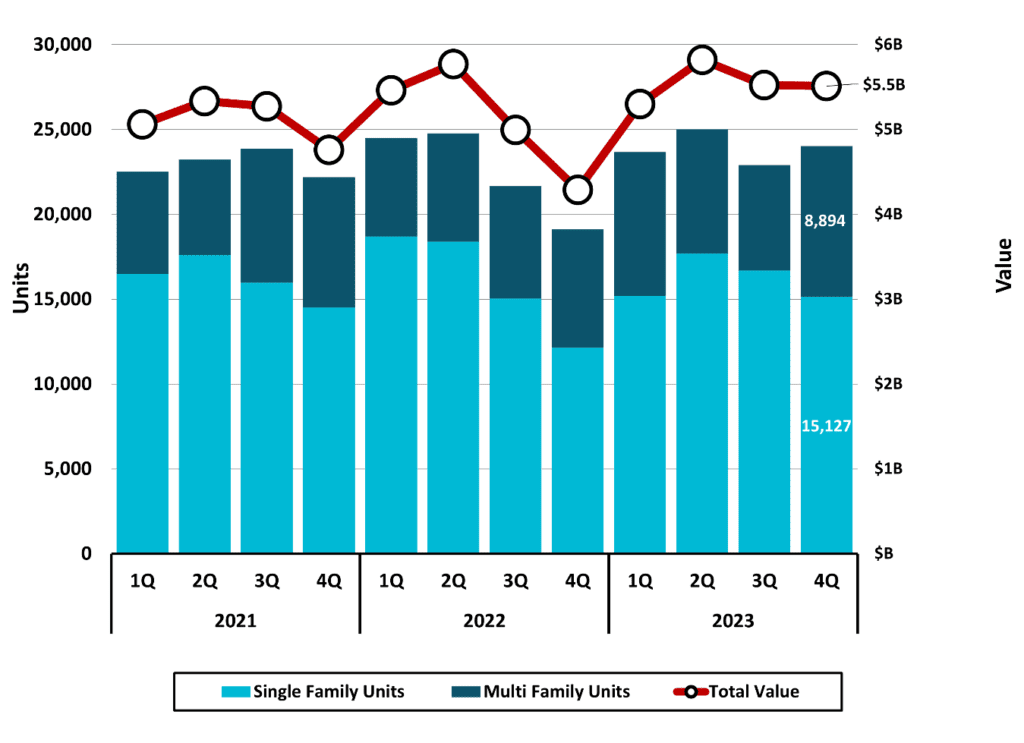
Permit activity for new residential building in the state of North Carolina totaled 24,021 units in the fourth quarter of 2023 with a value of $5,512,417,000 (Figure 9). In percentage terms, the total number of units permitted was 25.6 percent greater than a year prior, and the total value was 28.5 percent greater. Permitted multi-family units totaled 8,894 and accounted for 37 percent of total units. This marked a high point for multi-family units in any quarter dating back to 2020.
Figure 9
North Carolina
Estimated Residential Building Permits Activity*
 *Based on a survey of permitting agencies. The Census Bureau provides estimates for
any missing agency data, which typically amounts to less than 20% of the total permits.
Source: US Census Bureau
Retail Sales
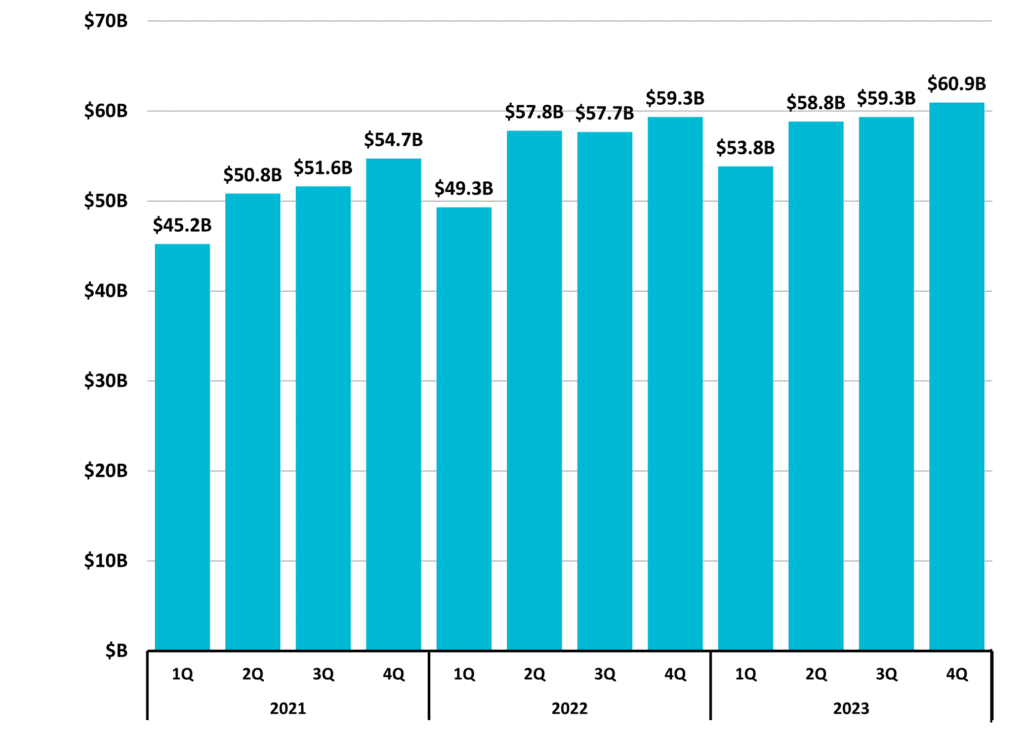
Taxable retail sales in North Carolina totaled $60,945,387,065 ($60.1 billion) in the fourth quarter of 2023 for a 2.7 percent increase compared to a year earlier (Figure 10 and Figure 11). This not only established a new high point for the state but also represented the first time the quarterly average surpassed the $60 billion threshold.
Figure 10
North Carolina
Total Taxable Retail Sales
 Includes collections of penalties, interest, and sales & use tax; and may reflect activity from prior periods.
Source: NC Department of Revenue
Figure 11
North Carolina
Total Taxable Retail Sales
Quarterly Year-to-Year Change (%)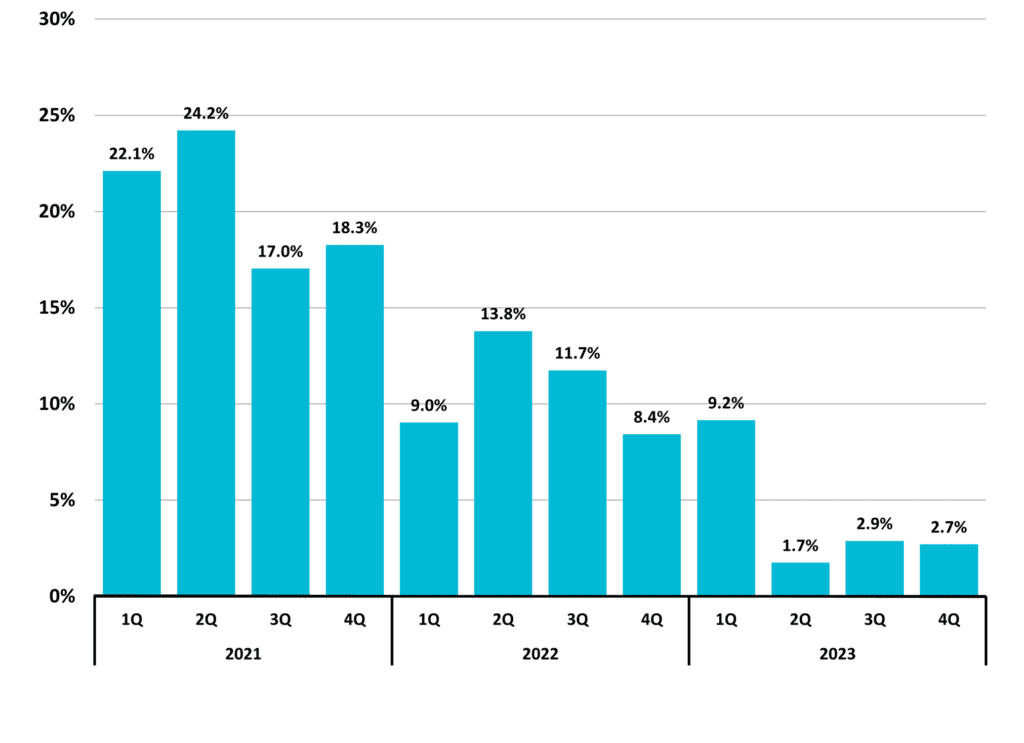 Includes collections of penalties, interest, and sales & use tax; and may reflect activity from prior periods.
Source: NC Department of Revenue
Special Feature:
Veteran Population
The U.S. Census Bureau defines veterans as people who are not currently serving but have served on active duty in the Army, Navy, Air Force, Marine Corps, or Coast Guard, or who served in the U.S. Merchant Marine during World War II.
In 2022, the Census Bureau estimated 6.2 percent of the civilian population aged 18 years and over had veteran status in the United States. Ninety percent were male. Fifty-one percent were between the ages of 18 and 64 while 49 percent were 65 years of age or older.
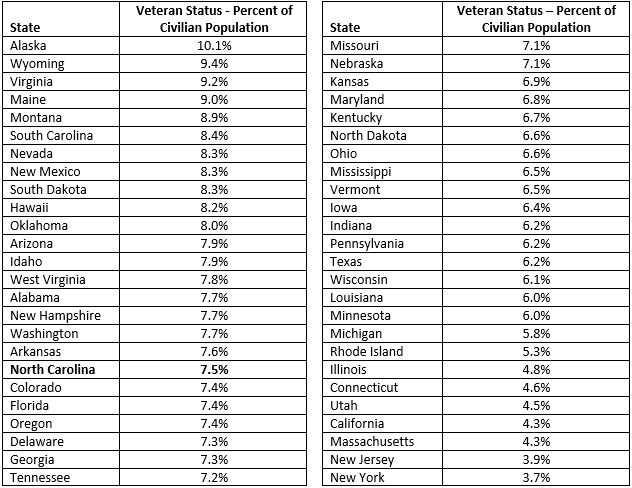
By comparison, in North Carolina the share of the civilian population with veteran status was estimated at 7.5 percent in 2022. Eighty-seven percent were male. Fifty-five percent were between the ages of 18 and 64 while 45 percent were 65 years of age or older. At 7.5 percent, North Carolina ranked 14th among the 50 states (Figure 12).
Figure 12
Veteran Status
Percent of Civilian Population by State
 Source: US Census Bureau
The business landscape is complex. Need help? Contact DMJPS.
For a printer-friendly version, click here.